
Designing an Operations Dashboard for a Growing Logistics Team
Illustrative case study: a practical approach to unifying dispatch, warehouse, delivery, and exception signals in a decision-focused logistics dashboard.
By jsyxiPublished
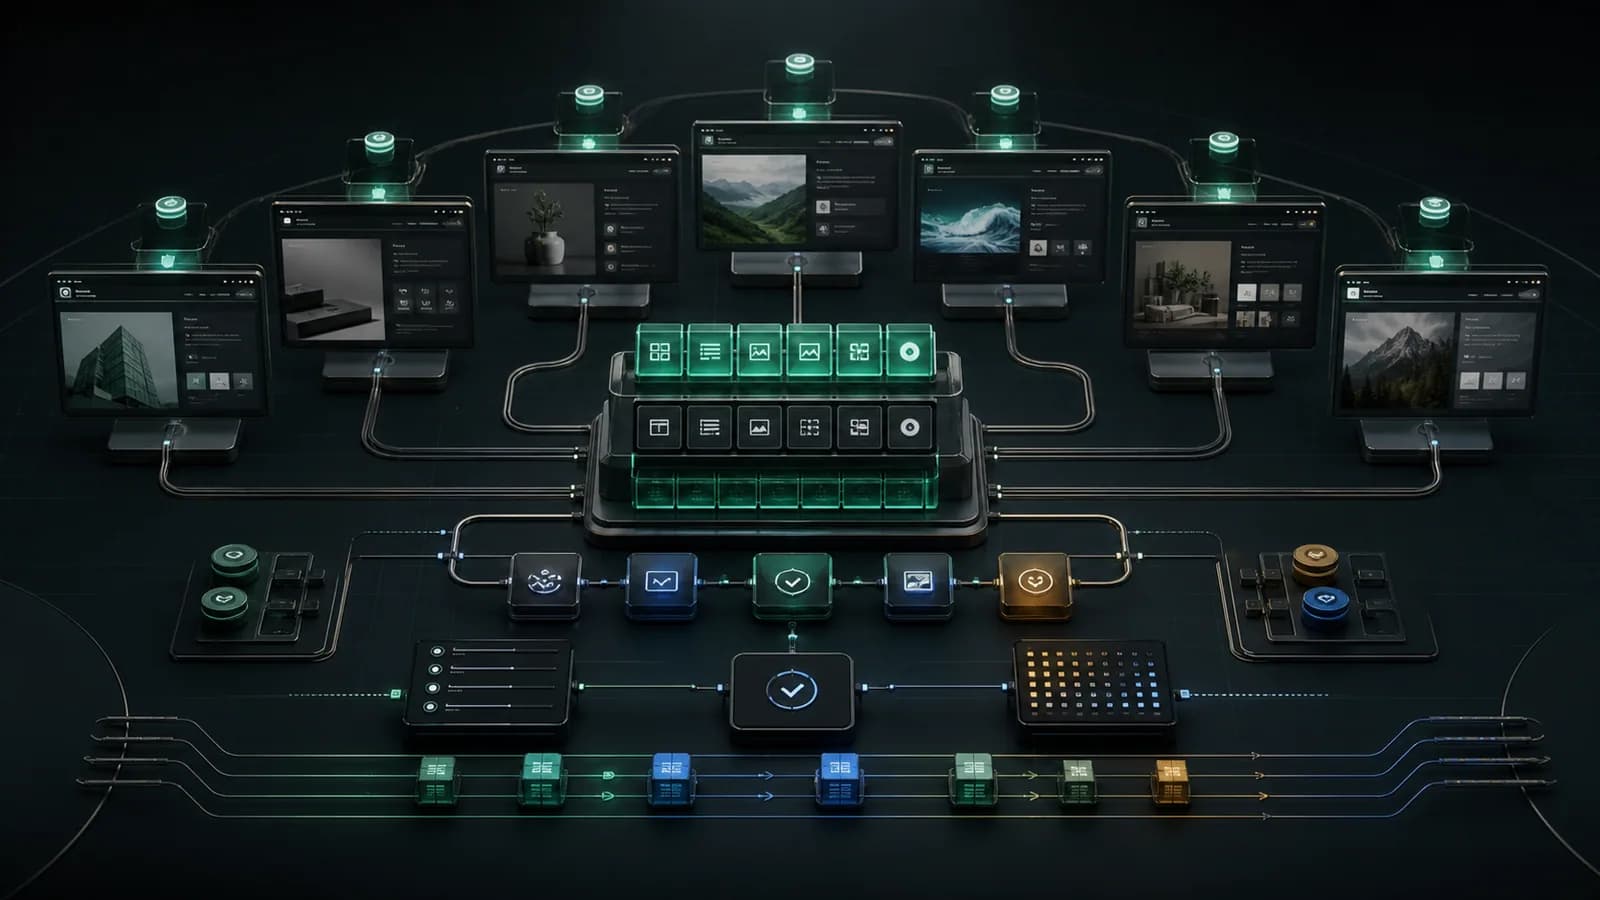
Illustrative case study: This is a representative scenario created to explain a possible delivery approach. It is not a named customer claim, testimonial, or guaranteed result.
Context
Imagine a logistics business whose daily operation has expanded across dispatch, warehouse coordination, partner carriers, and customer support. Each team has a useful tool, but nobody sees the same picture. Dispatch tracks movements in one system, the warehouse updates a sheet, carrier exceptions arrive by email, and support asks for status in group chat.
Leaders request a dashboard because the operation feels opaque. A dashboard alone will not repair missing events or unclear ownership, however. The real assignment is to define a trustworthy operational model and present the next decisions to each role.
The representative solution combines data engineering, workflow design, and a role-aware system application.
The challenge
Operational data is time-sensitive and uneven. A delivery shown as in transit may simply have a stale scan. A warehouse delay can look like a carrier delay if event definitions are inconsistent. A large wallboard may look impressive while hiding the few exceptions that actually require action.
Discovery should establish:
- the lifecycle from booking through collection, handoff, delivery, and closure;
- which system owns each event and timestamp;
- how freshness, confidence, and manual corrections are represented;
- which exceptions need action, who owns them, and how they are resolved;
- what dispatch, warehouse, support, finance, and leadership each need to decide;
- which information is operationally sensitive or restricted by role.
This work produces an event dictionary and ownership map before any chart is chosen.
Strategy
The dashboard should be a decision surface rather than a report gallery. Each view starts with the role's questions. Dispatch may need unassigned work and route exceptions. Warehouse leads may need arrivals, loading readiness, and blocked handoffs. Support may need a customer-safe status and the current owner. Leadership may need trend and capacity signals, not individual shipment details.
The shared model normalises events from source systems into a consistent timeline. Every status displays its source and freshness. Exceptions are prioritised using agreed operating rules, while manual overrides remain visible and auditable.
Instead of one screen for everyone, the system can provide a common operational foundation with focused views, saved filters, and drill-down detail.
Implementation approach
Delivery would begin with a narrow slice of the lifecycle that already has reasonably dependable data. That lets the team test definitions and behaviour before adding every partner and process.
A staged implementation might include:
- Observe real shift handovers and document the decisions currently made from spreadsheets, messages, and calls.
- Agree the canonical event schema, status transitions, exception categories, owners, and freshness expectations.
- Build ingestion connectors with validation, source timestamps, retry behaviour, and a quarantine path for malformed records.
- Create role-based views for work queues, exceptions, shipment timelines, capacity, and service communications.
- Add acknowledgement, assignment, notes, and resolution actions so the dashboard supports work rather than only displaying it.
- Make stale or incomplete data unmistakable; never present an old status as current certainty.
- Pilot with a defined operation, compare the screen with reality during live shifts, and refine definitions before broader rollout.
The UI should be tested on the actual devices and networks used by teams. Keyboard access, contrast, compact tables, readable maps, and predictable loading states matter more than animated charts.
Measurement plan
The measurement plan should connect the dashboard to operating behaviour. Candidate signals include:
- time from an exception event to acknowledgement and clear ownership;
- time spent reconciling the same shipment across systems;
- internal status enquiries that require manual investigation;
- records with stale, missing, or contradictory events;
- exceptions reopened after an incomplete resolution;
- use of manual overrides and the reasons behind them;
- shift-handover items without an owner or next action.
Teams should review these alongside service outcomes and qualitative feedback. Faster acknowledgement is not useful if staff close alerts merely to clear the queue.
Guardrails
Operational screens must not claim precision the source data cannot support. Each event needs provenance, timestamps should preserve the relevant timezone context, and a clear degraded mode should explain outages or delayed feeds.
Role-based access should restrict customer, driver, pricing, and partner information. Manual changes need an audit trail. Alert rules require review so urgent events remain meaningful instead of becoming background noise. A rollback and incident procedure should exist before the dashboard becomes part of a live shift.
The team should also keep source systems operational. A visual layer must not become a hidden single point of failure for the whole business.
Definition of success
Success in this representative scenario means:
- each role can identify its next operational action quickly;
- status, freshness, source, and ownership are visible together;
- exceptions move through a consistent acknowledgement and resolution process;
- shift handovers rely on traceable records rather than memory alone;
- incomplete data is surfaced honestly;
- the dashboard can expand to new partners without redefining the whole lifecycle.
For a similar operations programme, explore custom software development, review the wider tools catalogue for lightweight workflow experiments, or contact the team to plan a defensible first release.
Could this approach fit your business?
Start free, or book a consultation to turn the most relevant ideas into a practical plan.